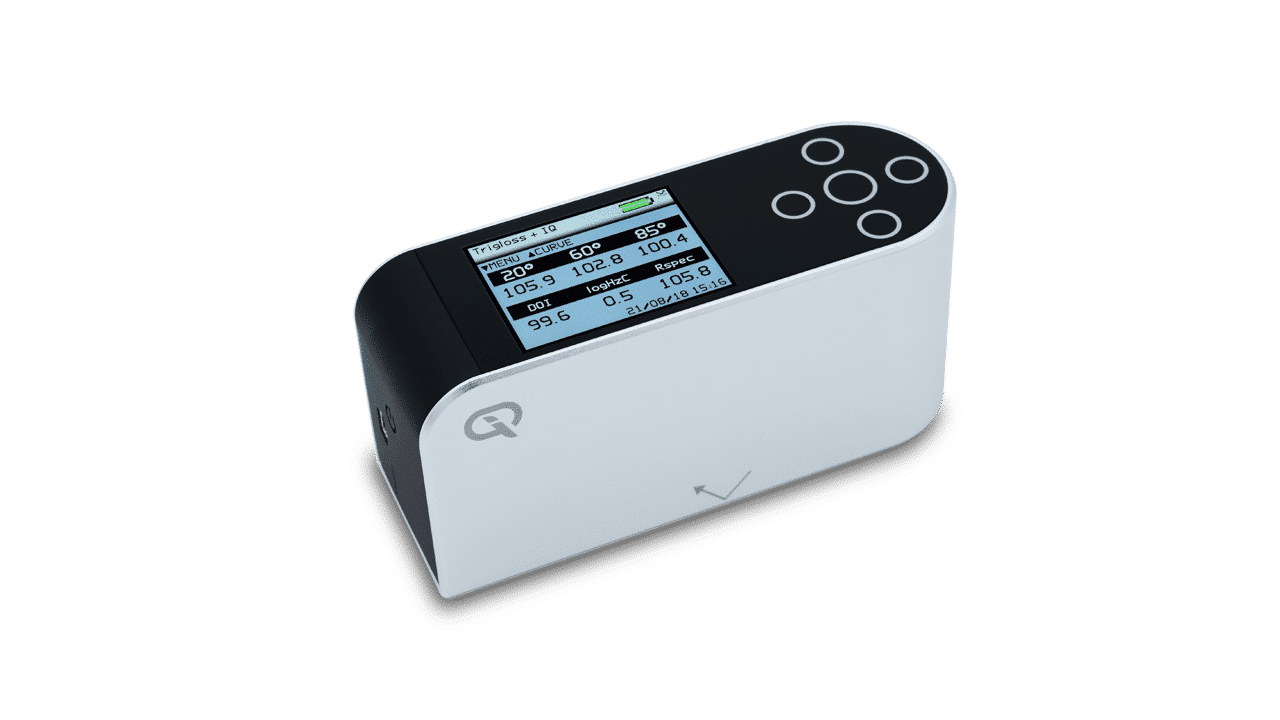
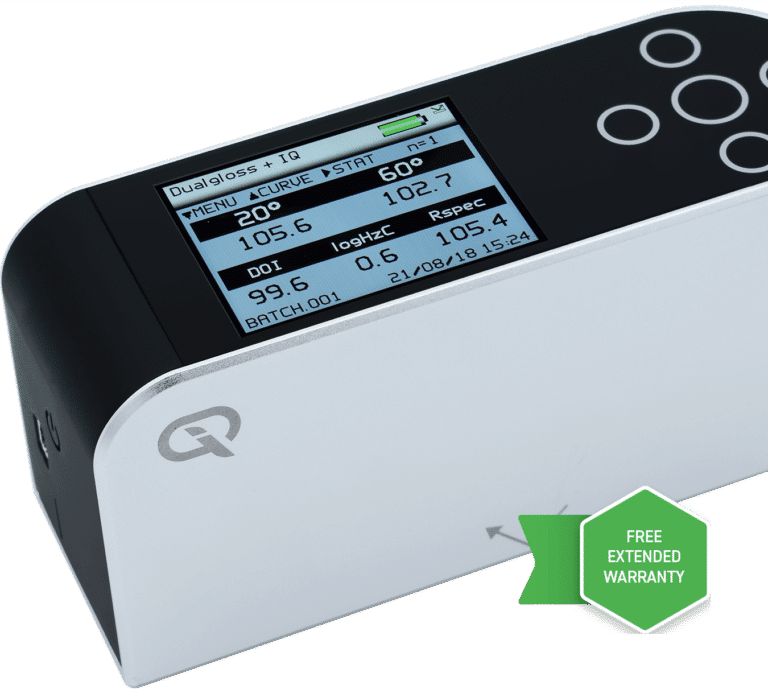
The Rhopoint IQ Concrete Clarity Meter measures Reflected Image Quality; it is the only hand held instrument that profileshowlight is reflected from a surface. Glossmeters are usually used to measure the shininess of a surface but are not sensitive to other effects which reduce appearance quality.
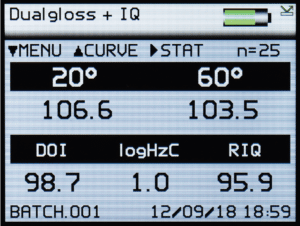
The Concrete Clarity Meter (CCM) can measure
20/60° Gloss
RSPEC
Reflectance haze
Reflected image quality (RIQ)
Distinctness of Image (DOI)
Unlike a standard glossmeter the IQ Concrete Clarity Meter has the unique capability of measuring and detecting quality problems caused by microscopic texture in the surface that cause haze and orange-peel effects which lead to poor Distinctness of Image (DOI).
These factors can seriously affect the visual impact and reflective quality of many coated, painted and polished surfaces. By measuring the quality of the reflected image it accurately profiles how light is reflected from a surface.
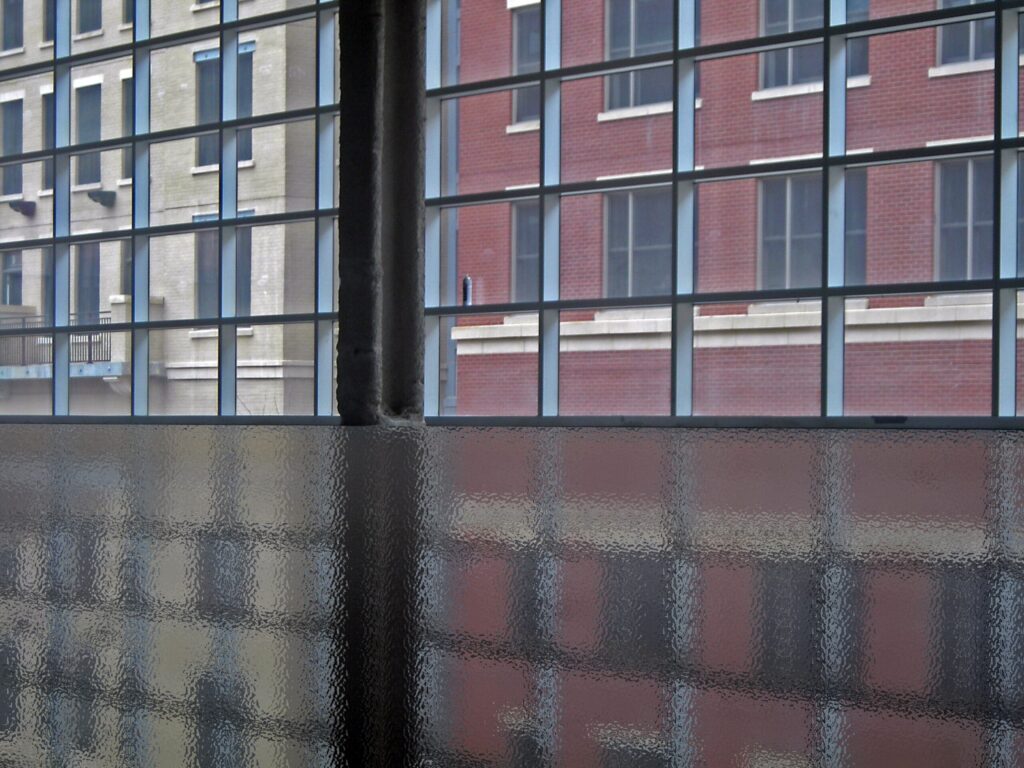
Distinctness of Image (DOI)
A measure of how clearly a reflected image will appear in a reflective surface and is used to quantify effects such as orange peel and surface waviness.
Orange peel dramatically reduces appearance quality without affecting gloss readings. The Rhopoint IQ Concrete Clarity Meter with DOI measurement can quantify the differences.
Surface with poor DOI
Haze is a common problem associated with coatings and polished materials. Surfaces with haze have a “milky” finish with a “shallow” reflected image. This important characteristic is directly measured with the Concrete Clarity Meter.
Surface with high haze.
Images courtesy of Curviello Concrete
Reflectance Haze
An optical effect caused by microscopic texture or residue on a surface.
Visible Symptoms: A milky finish is apparent on the surface with a loss of reflected contrast. Halos and patterns can be seen around reflections of high intensity light sources.
Causes: Resin transfer, lack of refinement, burnish and polishing marks, fine scratches, poor cleanliness/surface residue.
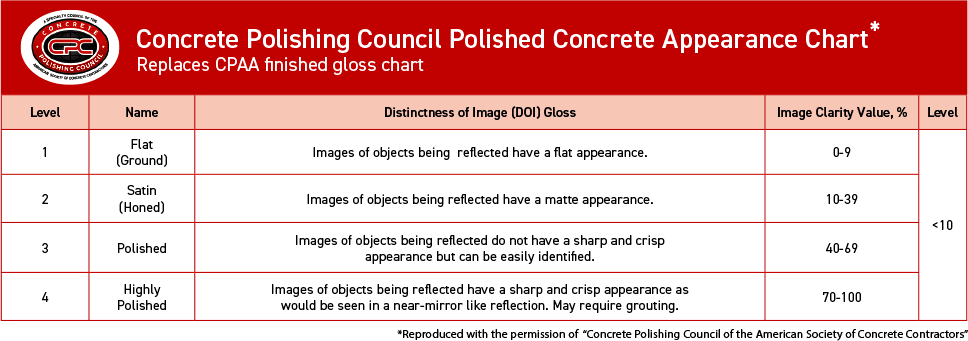
Distinctness of Image (DOI) Gloss
DOI is the sharpness of images of objects produced by reflection at a polished surface, sometimes called image clarity.
Measurement by Image Clarity Meter: The DOI, Image Clarity Value, obtained from this test method, range from 0 to 100 with a value of 100 representing perfect DOI (image clarity).
Haze
Haze is the cloudiness or milky appearance of images of objects produced by reflection in a polished surface.
Measurement by Glossmeter (ASTM D4039): The Haze Index, obtained from this test method, is computed using the numeric difference between the value of specular gloss at 60° and the value of specular gloss at 20°.
Measurements for Compliance
The Image Clarity Meter and Glossmeter must be calibrated. The minimum number of tests distributed across the polished surface should be three for areas up to 1000ft² and one additional test for each 1000ft² or fraction thereof. This applies to both the Image Clarity Value and Haze Index. The mean (average) values of the test results should be used to evaluate compliance with the chart.
Features
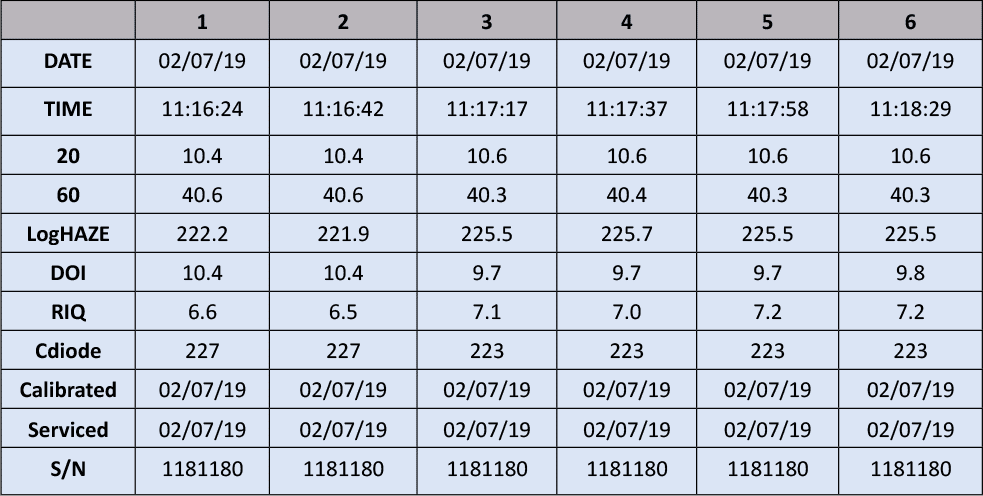
Simultaneous measurement of all parameters, results
are date/time stamped.
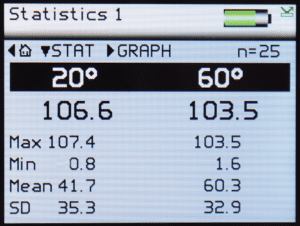
Statistics per measured parameter.
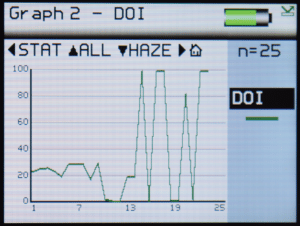
Graphical reporting for quick trend analysis.
Easy Batching
User definable batch names and batch sizes for quicker and more efficient reporting.
Software-free Rapid Data Transfer
USB connection to a computer instantly recognises the device as a drive location which facilitates the quick transfer of files using Windows File Explorer or similar programs.
Direct Data Input via Bluetooth
Instantly transmit measured readings
directly to programs such as Microsoft Excel
on your computer, tablet or smart phone to greatly
simplify the reporting process.
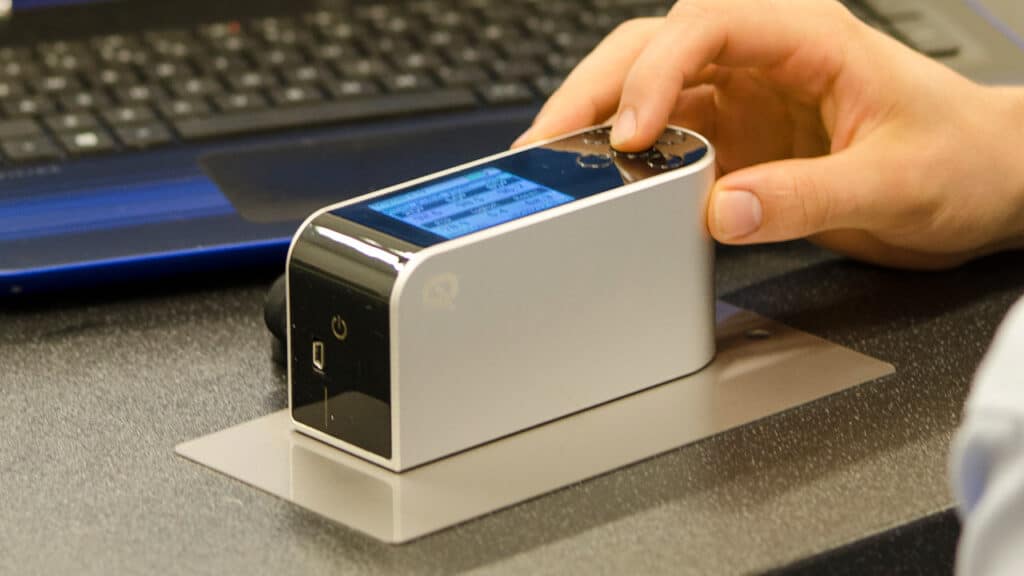
Operation
Full colour easy to read screen
Adjustable brightness
6 button touch sensitive interface
Construction
All aluminium construction – enclosure, optics, standard holder
Integrated calibration holder with in-position detector for error-free calibration
Specifications
Measurement
20° Gloss
Range
0 - 100 GU
100 - 2000 GU
Repeatability
0.2 GU
0.2%
Reproducibility
0.5 GU
0.5% *
Resolution
0.1 GU
Measurement Area
6mm x 6.4mm
Standards
ISO 2813 | ASTM D523 | ISO 7668 | ASTM D2457 | DIN 67530 | JIS Z 8741
60° Gloss
Range
0 - 10 GU
10 - 100 GU
100 - 1000 GU
Repeatability
0.1 GU
0.2 GU
0.2%
Reproducibility
0.2 GU
0.5 GU
0.5% *
Resolution
0.1 GU
Measurement Area
6mm x 12mm
Standards
ISO 2813 | ASTM D523 | ISO 7668 | ASTM D2457 | DIN 67530 | JIS Z 8741
* A mirror gloss calibration standard is required to achieve this reproducibility
Instruction manual Bluetooth data app Example Excel spreadsheets Novo-Gloss Multi Gauge software Instructional videos
Calibration Tile
High gloss calibration tile with cleaning cloth
Sample Positioning Templates
Quick Start Guide
Order Codes
Rhopoint IQ Concrete Clarity Meter
A6000-013 CCM
To ensure accurate and reliable results, Rhopoint Novo-Gloss Instruments are supplied with standards calibrated and certified according to ISO 17025 UKAS.