+44(0)1424 739 622

Table of Contents

FAQ Categories

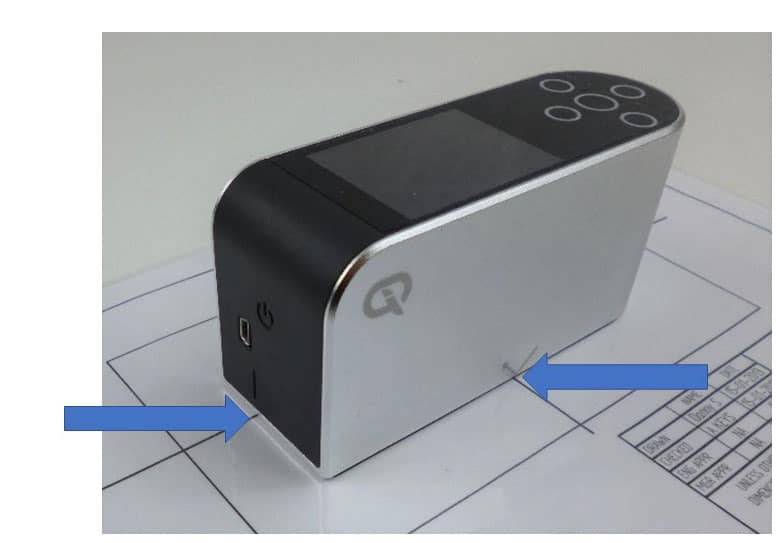
Novo-Curve 4 Application Notes – Gloss Measurement Of Moulded Plastic Parts

Novo-Curve 4 Application Notes – Gloss Measurement Of Moulded Plastic Parts

Overview

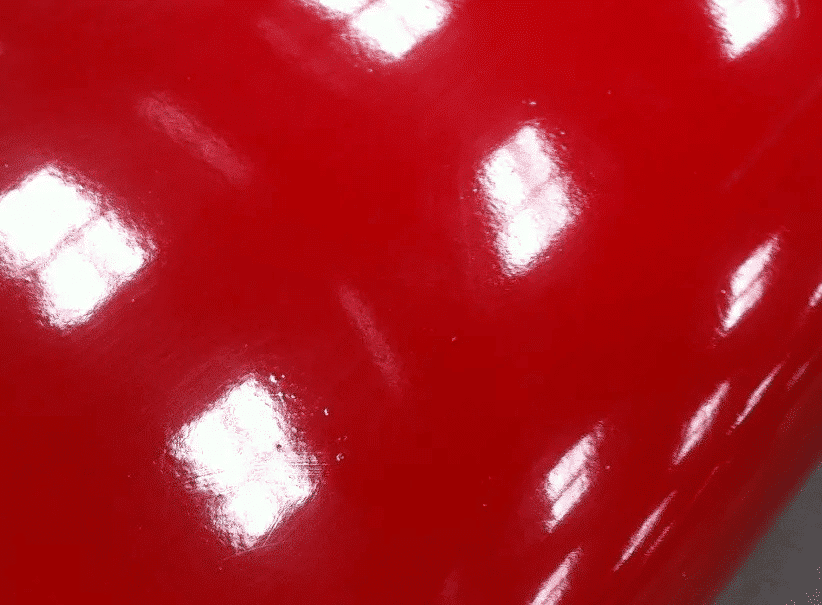
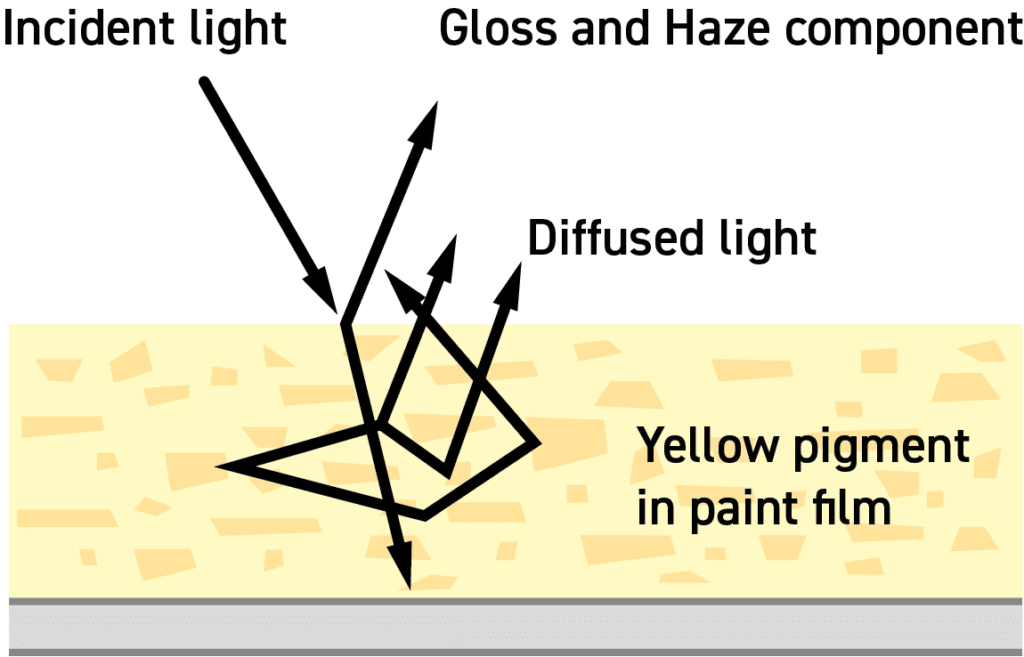
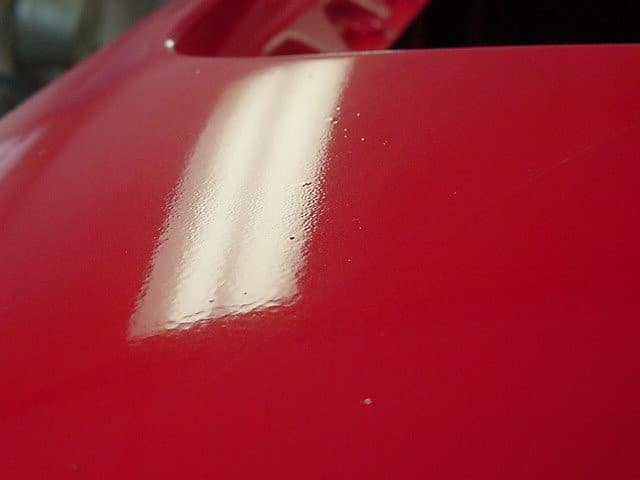
Gloss has been defined as ‘The attribute of surfaces that causes them to have shiny or lustrous, metallic appearance.’

Manufacturers design their products to have maximum consumer appeal. Traditionally, a high gloss finish is often perceived to be a higher quality product and can therefore command a price-premium.
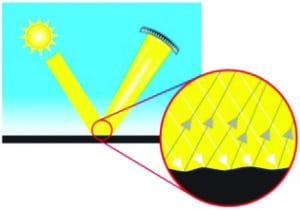
It is for these reasons that many manufacturers monitor the gloss of their products to ensure batch-to-batch consistency of their products.
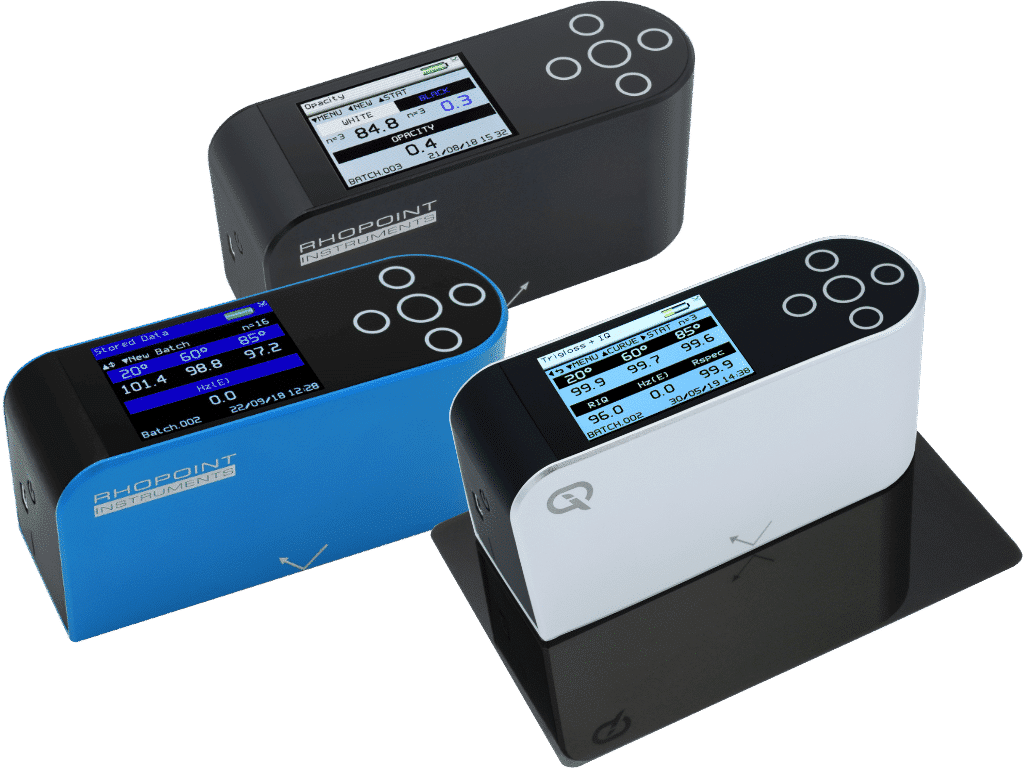
Method

Example – Evaluating high clarity blister packs

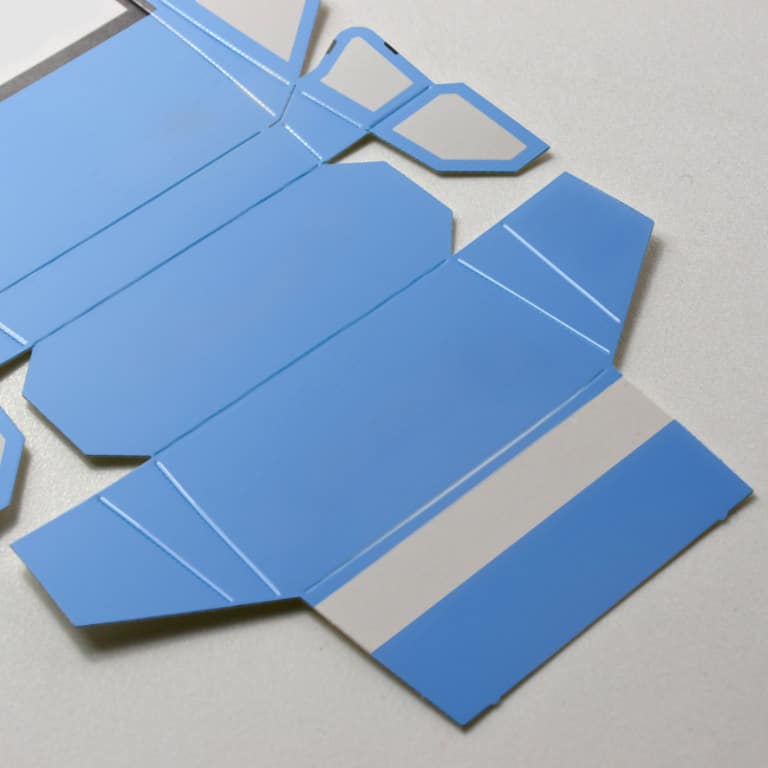
STEP 1: The two sections of the part were separated for measurement.
STEP 2: Using the continuous read setting on the Novo-Curve the sample areas were measured and the maximum values recorded for each area. This was repeated 6 times lifting and replacing the sample each time along the marked area on the surface.

STEP 3: Different values were measured along the measuring beam axis (sample in line with axis) to values measured across the sample (sample at 90 degrees to measurement axis).

Results

Example – Blister Packs

Conclusion

Observations of results

It was possible to obtain accurate peak (actual) gloss measurements for each part.

It may also be useful to consider a custom location adaptor for the samples, this can be 3d printed to suit each part which should improve accuracy due to improved location.

Features of the Novo-Curve

Simple checking of curved surfaces

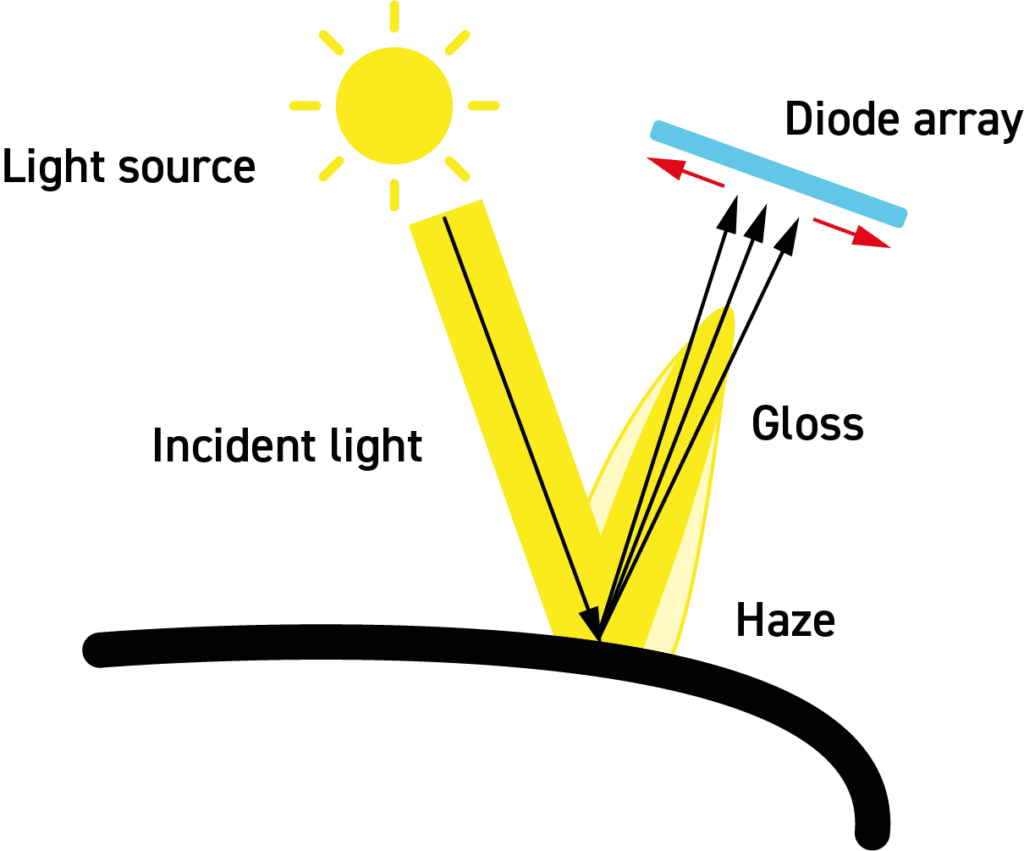
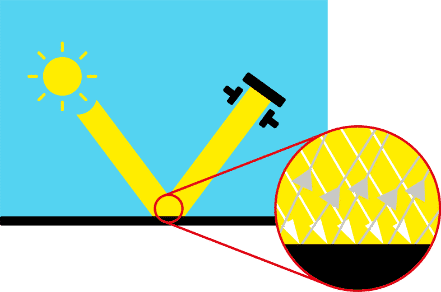
For curved surfaces, the correct gloss value is the peak value identified on the sample. Continuous read mode on the Novo-Curve 4 greatly simplifies this process.

Certainty of measurement

For improved gloss control, calibrate on a standard that matches closest to your sample. Additional standards are available from matt to mirror finish.

Repeatable sample positioning

Bespoke sample securing systems allow multiple samples to be measured in exactly the same place*. *Requires additional accessory
Novo curve footswitch

Hands free sample measurement

The optional footswitch enables the user to easily manipulate the sample for measurement.

Measurement of small samples

Measure samples too small to be measured with a standard glossmeter.

Custom Part Adaptors

For an exact fit for small complex shapes, a custom cutout enables the sample to measured in exactly the same spot each time.

Rhopoint ID Application Notes – Abrasion on transparent materials

Rhopoint ID Application Notes – Abrasion on transparent materials

Overview

Transparent materials such as acrylic (PMMA), polycarbonate (PC) and glass play an important part in our every day life. They are commonly used in a wide range of industries including electronics, packaging, building, medical, automotive and aerospace.

According to their function, these materials are generally required to allow an undistorted and visually clear image of the content that is behind. In some applications it can be critical for safety reasons and for others, to allow excellent viewing quality of products and/or information. Indeed some applications require a combination of obscurity and full transparency for instance smart glass. For each application the correct selection of polymers and resins used to manufacture the material is essential in ensuring optimum mechanical and physical properties.

Abrasion resistance of PMMA and PC presents challenges to the manufacturer and may require modifications to be made to the polymers or the use of coatings on the surface to improve wear characteristics.

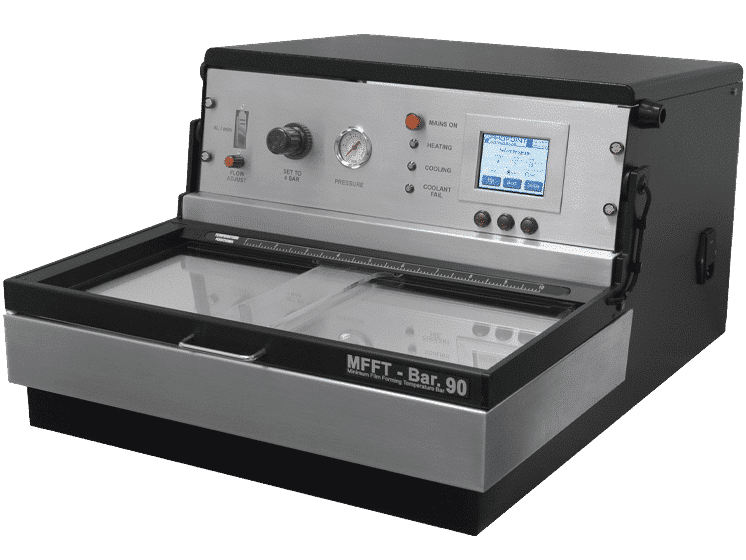
Taber Model 1700
Image courtesy of Taber Industries

To simulate wear, a test method – the Taber Abrasion test to ASTM D1044 utilising CS-10F wheels was adopted. Taber tests involve mounting a flat to a turntable platform that rotates on a vertical axis at a fixed speed. Two abrasive wheels, applied at a specific pressure, traverse a complete circle on the specimen surface. The resulting abrasion marks form a pattern of crossed arcs in a circular band that cover an area approximately 30 cm2. At the end of the test, the change in transparent quality, mainly haze, is measured using a hazemeter.

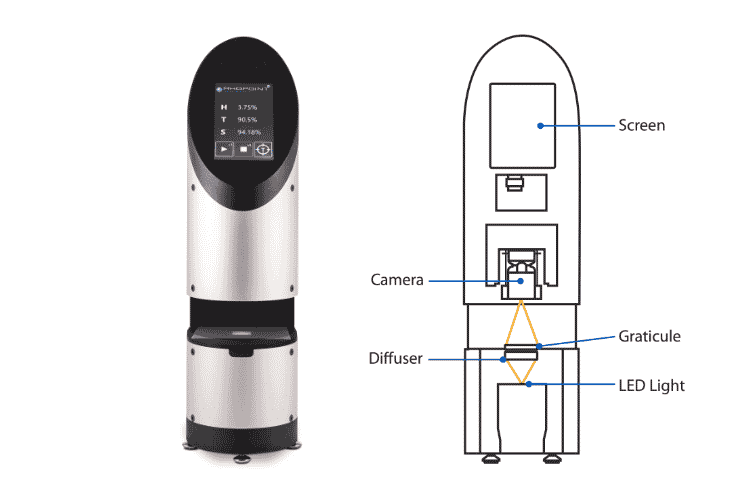
As the orientation of a hazemeter conforming to ASTM D1003 is typically horizontal, a special mounting adaptor needs to be used to hold the sample to the measurement port. The Rhopoint ID, thanks to its high correlation to ASTM D1003 is a vertically oriented instrument making sample mounting quick and very easy allowing compatible measurements to now be made.

Process

Example – PMMA

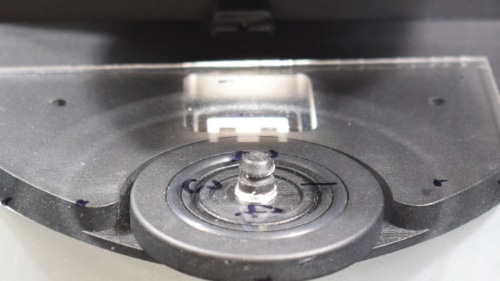
STEP 1: Customer supplied samples of rotary abraded (using Taber Model 1700) and non-abraded PMMA material were tested. The Abrasion Adaptor, available as an optional accessory, allowed the samples to be mounted and easily rotated over the graticule for ASTM equivalent haze (HASTM) measurement.

Quadrant 1
Quadrant 2 Close up

STEP 2: The abraded sample was mounted onto the table and a measurement taken.

Quadrant 3
Quadrant 4

STEP 3: The table was then sequentially rotated 90 degrees each time and further measurements made. This process was then repeated for the non-abraded sample for comparison.

Results

Example – PMMA

Abraded Sample

Non-abraded Sample

Observations of results

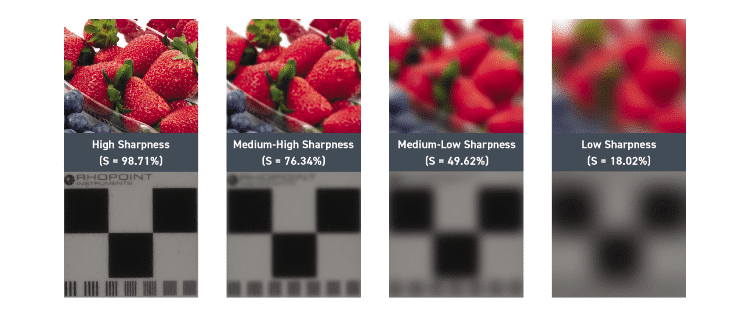
The measurement data shows the reduction in optical quality due to Taber abrasion. The abraded sample shows a higher Haze and lower Sharpness value indicating surface roughness is present; the hardness of the material surface being insufficient over the test cycle to withstand the abrasion. Matching the material formulation to the application allows quality improvements and cost savings.

Features of the Rhopoint ID

Rhopoint ID Application Notes – Blister Packaging

Rhopoint ID Application Notes – Blister Packaging

Overview

Blister Packaging, a versatile pre-formed plastic packaging material, is used in a number of different industries including consumer goods, electronics, and pharmaceuticals.

A thermo forming process is used to create a cavity or pocket made from a formable transparent plastic web, the size and shape of which is determined by the product for which it is required. This cavity or pocket is typically heat sealed onto an adhesive coated cardboard or foil to trap the contents in place underneath creating a typical blister pack.

There are many types and variations of blister packs that are used, selected according to the product requirements. Some types like face seal blisters incorporate a flanged blister to surround the product, which is heat sealed onto piece of cardboard, the seal therefore is only on the flange while the rest of the cardboard stays uncovered (usually printed).

Others like the clamshell blister pack incorporates the blister in a hinged two half container that opens and closes, due to its robustness it is therefore suitable for heavy products.

Whichever type of blister packaging is used, clear undistorted visibility of the contents is essential, not only from and aesthetic point of view of the product underneath, but in pharmaceutical applications critical to allow the pharmacist to visually check markings on the individual doses of medication.

The thermo forming method used to create the cavity is therefore a critical stage in the process as there are several factors that can influence the optical quality of the blister. Material selection, forming temperature and mould condition all need to be correctly controlled to prevent substandard end products being produced.

Due to the complex shape of this type of packaging, visual quality checks of the blister windows have mostly been used as it has been impossible to perform measurements using traditional sphere-based transmission hazemeters. Thanks to its innovative design, the Rhopoint ID overcomes this issue providing a powerful measurement solution for quality control.

Process

Example – Evaluating high clarity blister packs

STEP 1: A manufacturer of pharmaceutical blister pack materials supplied five samples from their different worldwide manufacturing locations for analysis. The manufacturer was concerned about the wide variation of visual quality of materials from each location and issues that could be caused due to variations in optical clarity.
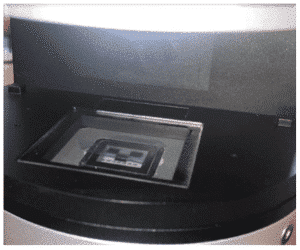
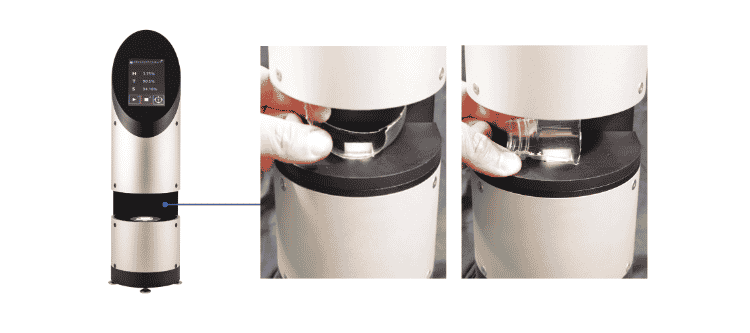
Blister material seated on the measuring pane

STEP 2: The samples were mounted onto the surface roughness and small parts ASTM (8mm) adaptor on the measurement graticule to obtain results compatible with ASTM D1003.

The complex shape of the blister material did not present any problems during measurement as there was sufficient coverage of the material over the measurement graticule of the Rhopoint ID.

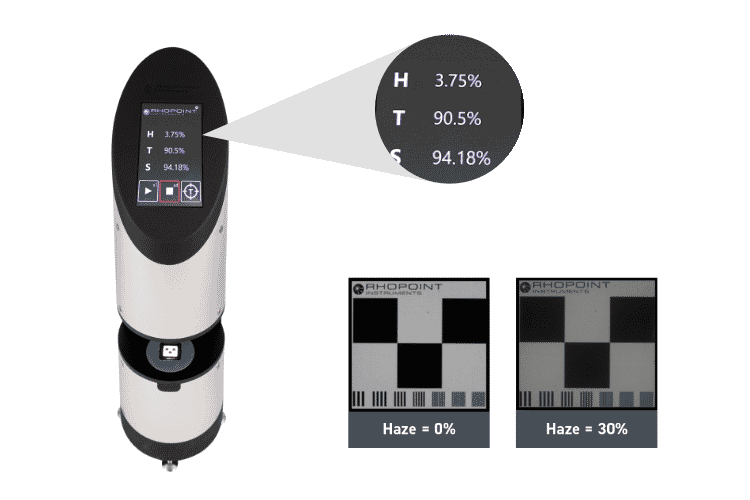
STEP 3: Each sample was measured 4 times over the surface area using Rhopoint ID-L to obtain results for Sharpness (S) and Haze (HASTM).

Results

Example – Blister Packs

Measurement Results

A total time of 20mins was taken to measure all samples (4 times x 5 samples – 20 measurements) each of which were manually manipulated during measurement.

Using the Rhopoint ID-L software the measurement data and images were then analysed to identify changes in optical quality. Average results were calculated and used for the purpose of this report.

SAMPLE 1 / CONTROL 1
Sharpness: 83.72
Haze: 5.03
SAMPLE 2 / CONTROL 2
Sharpness: 83.96
Haze: 4.58
SAMPLE 3 / LOCATION A
Sharpness: 7.66
Haze: 27.60
SAMPLE 4 / LOCATION B
Sharpness: 9.02
Haze: 24.8925
SAMPLE 5 / LOCATION C
Sharpness: 47.86
Haze: 9.915

Observations of results

Analysing the results, the variation of Haze and Sharpness across the samples could be observed.
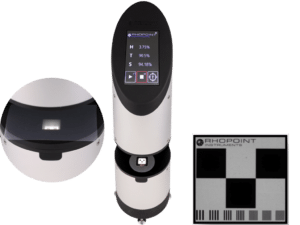
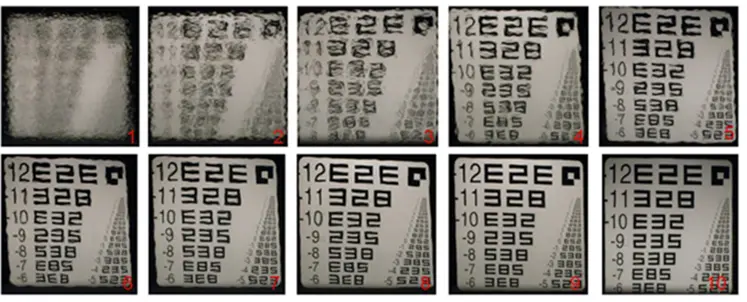
Looking in detail at the images for Samples 3 – 5 there appeared to be a texture present on the surface causing a distortion (when viewed at the point where the black and white areas of the measurement graticule meet). This texturing appears higher on Samples 3 & 4 (resulting in a higher haze and lower sharpness) due to the smaller size of the texture whilst on Sample 5, due to the texturing being larger, the haze is lower and sharpness higher.
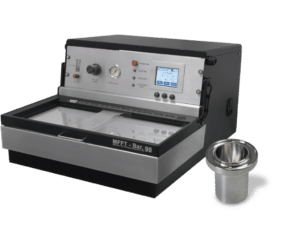
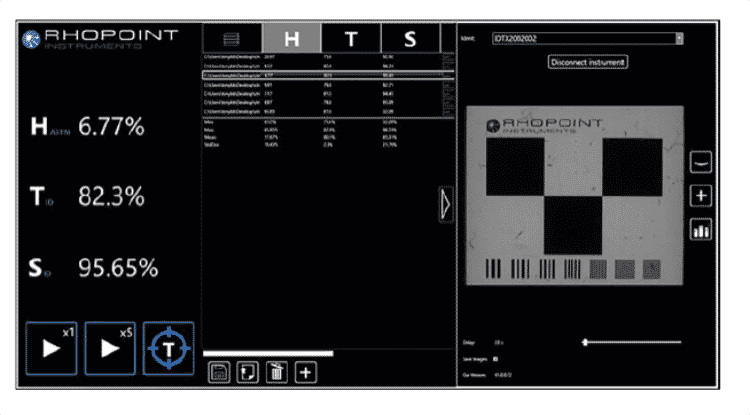
The ability to obtain numeric and image data from the Rhopoint ID allows visual confirmation of the data.
As previously mentioned the measurement of these samples, due to their shape and size, would have been impossible using a traditional hazemeter.

Features of the Rhopoint ID

Rhopoint ID Application Notes – Clarifying Plastics

Rhopoint ID Application Notes – Clarifying Plastics

Overview

For many end-use products including food packaging, medical devices and transparent household and cosmetic containers, Polypropylene (PP) is a natural choice over many other materials due to its low cost, excellent mechanical properties and easy processing.

However, neat PP is translucent or opaque due to the particular semicrystalline arrangement of the polymer chains which presents an obstacle for its use in applications requiring maximal see through quality. By using so-called ‘clarifying agents’ as additives, the optical transparency of PP and several other commodity polymers can be conveniently improved to, essentially, match that of glass or amorphous plastics, without compromising its superior mechanical properties.

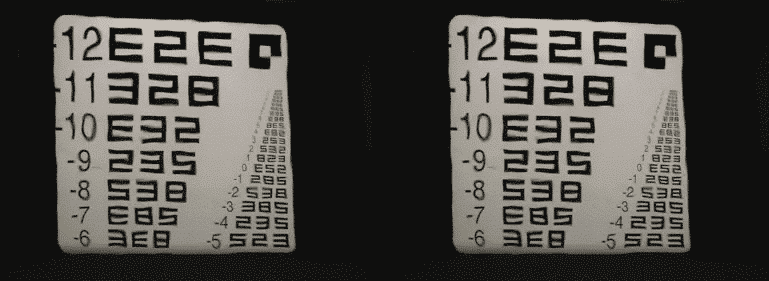
The image shows two PP samples:
one containing a clarifying agent (right) and the other in its neat, unblended form (left).

The image viewed through the sample features the highest contrast and sharpness of details.

The resulting transparent characteristics of PP are strongly dependent on a number of factors; most importantly: the specific clarifier used, its concentration and processing temperature. To ensure an optimal trade-off between the required transparency and cost increase via the use of expensive additives, haze and other transparency metrics are commonly measured during process development and production phases.

Rhopoint ID enables this analysis with an unprecedented level of detail and precision.

Process

Example – PP samples with varying clarifier content

STEP 1: The samples are mounted directly onto the ASTM spacer adaptor on the measurement GRATICULE.

Ten injection-molded PP plaques were used to analyse the effect of a varying content of a sorbitol-based clarifying agent on the resulting transparency. Each sample was individually tested using Rhopoint ID-L to provide the respective values of Haze (HID), Sharpness (S) and Visible Transmittance (VT).

Reference measurements of ASTM Haze (HASTM) were performed using a sphere-based ASTM D1003 haze-meter.

STEP 2: Rhopoint ID-L software allows to observe and quantify the changes in optical transparency.

STEP 3: Images and data are collected for all samples.

Results

Example – PP Samples with varying clarifier content

Exemplary images and data for two PP plaques: neat and optimally clarified

The data below shows zoomed-in views of the graticule, haze (ID and ASTM), sharpness and visible transmittance for PP samples with varying clarifier content. The sample range featuring exhibiting maximal transparency is highlighted.

Maximum transparency (i.e. lowest haze and highest sharpness and visible transmittance) is observed for a narrow, 600–1000 ppm concentration range of the clarifier, as shown by the highlighted data regions.

A close correspondence is found for the ID- and ASTM haze data.

Comparison of data and graticule images confirms that the quantitative analysis correlates closely with the visual perception of transparency.

Sharpness and Haze(%) vs Clarifier (ppm)

Observations of results

The measurement results provide valuable data to determine the haze variation and the maximum peak haze value of the film over a distance range. The addition of images allows visual comparison of each measurement due to the change in distance. Matching the material exactly to the application allows quality improvements and cost savings.

Results

RESULTS – Advanced transparency analysis content

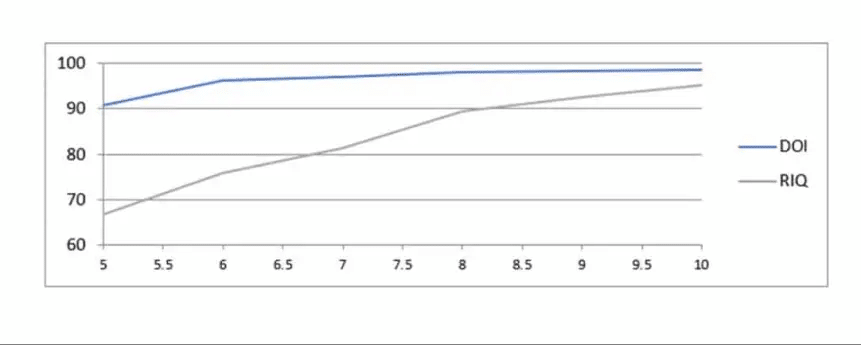
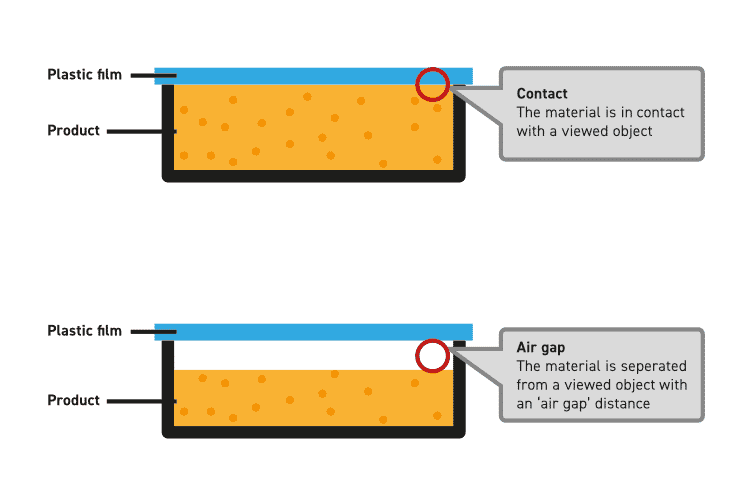
In addition to the measurements above, Rhopoint ID-L can provide a more sophisticated analysis of transparency that is outside the capabilities of sphere-based haze meters. Identification and elimination of local defects This includes common defects such as dust, scratches and processing imperfections. By virtue of being an imaging-based technique, data can be obtained for the entire graticule or its individual regions to provide spatially-averaged or local values. Analysis of airgap-specific transparency Can be used to determine optimal, application-specific material formulations and processing conditions, as well as establish transparency benchmarking. The example below shows haze for clarified PP at different ‘airgap’ distances.

If the material is intended to be used in contact for packaging applications and an upper limit of haze = 3% is required then the analysis determines the optimal clarifier content of 200 ppm.

In comparison, sphere-based hazemeter measurements provide an airgapidependent optimal value of 800 ppm. Hence, Rhopoint ID-L enables substantial cost savings by allowing to minimise the use of expensive additives.

Analysis of fluorescence impact on transparency Can be used in the case of whiteners and fluorophores employed as additives in, e.g. packaging and cosmetics industry sectors. The example below shows haze values measured with white and filtered light.