
Viewing Measurement Images and Graphs
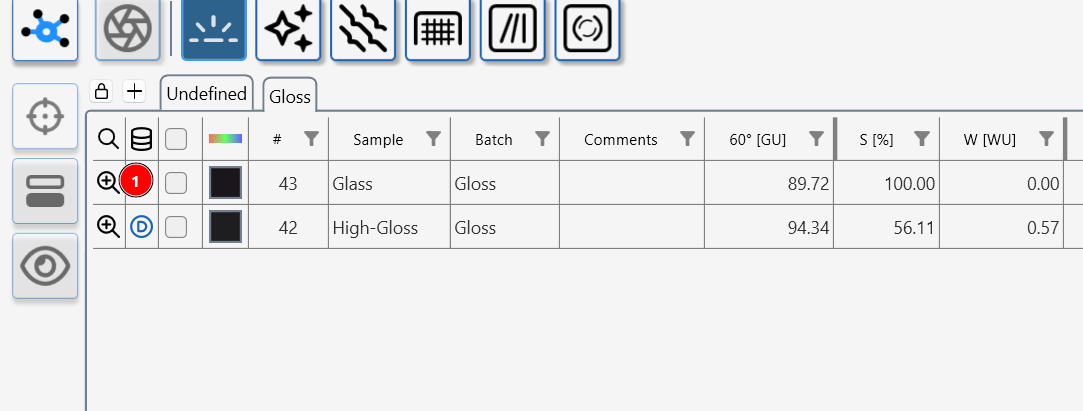
Clicking the magnifier icon (1) opens a detailed view of the selected measurement, giving access to all associated images and graphs for that result. This lets you go beyond single numbers and explore how the surface or material actually looks and behaves under the instrument’s optics.
What you can see with the magnifier
Depending on the connected instrument and active module, the magnifier view can include:
- Gloss camera images (Aesthetix / gloss modules): High‑resolution images showing specular reflections, linking gloss, haze and DOI values to visible effects such as halos, streaks or hotspots.
- Topographical maps (Rhopoint TAMS, Aesthetix Texture): 3D height maps and 2D contour views that reveal hills, valleys, orange peel and texture cells, with tools for zoom, rotation and cross‑section profiles.
- Surface images and defect overlays (Aesthetix scratch/defect modules): Observer‑camera images with highlighted scratches, dents or contamination overlaid on the real surface image.
- Profiles and graphs (all instruments): Line profiles, roughness plots, reflectance or appearance curves that show how key metrics change across the measured area.
Why this is useful
- These instrument‑specific images and graphs make it much easier to understand why certain values are high or low, by directly showing the underlying defects, texture, structure or optical behaviour.
- They support rich reporting, allowing you to combine numeric metrics (gloss, haze, waviness, roughness, transparency, scratches, etc.) with visual evidence (images, maps, profiles) when communicating with colleagues, customers or suppliers.
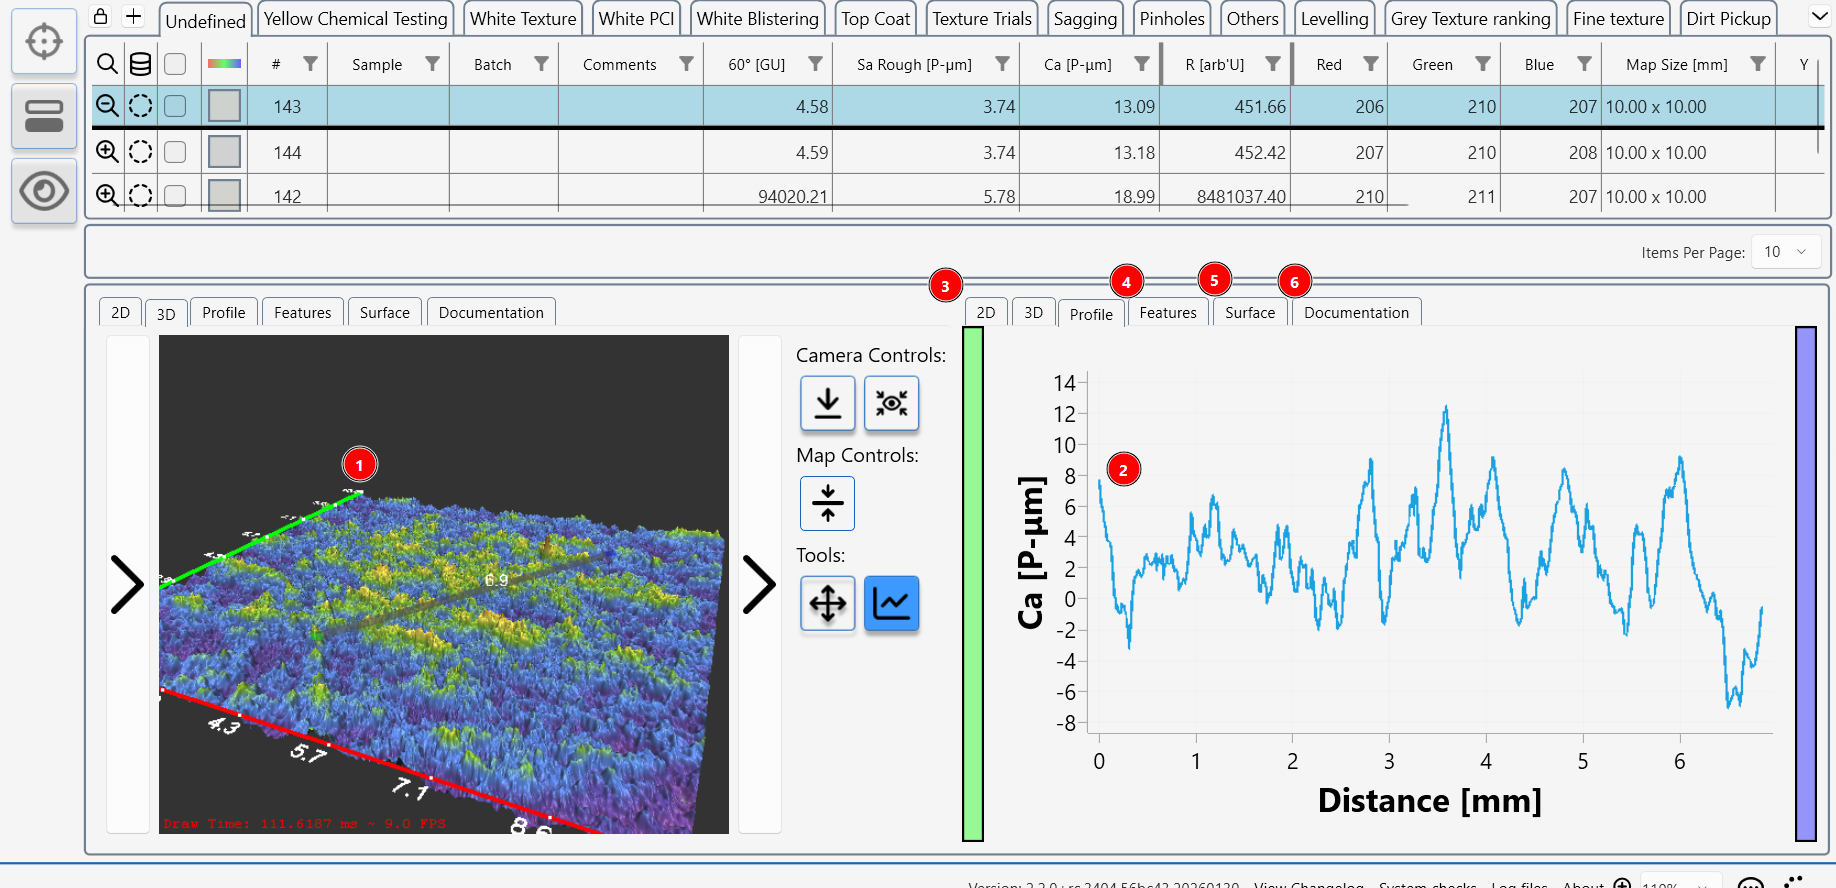
An example image from the Texture module shows a detailed topographial map (1) of the surface and a user selected surface profile (2) from the map.
Clicking on the tabs shows other options 2D surface map (3), watershed feature analysis (4), a colour surface image (5) and a section where the user can take and store photographs of the sample and add further information.