Evaluation of a steel sample set ground with grits K36 to K600, with and without a brushing step
A set of steel samples ground with grits from K36 (coarsest) to K600 (finest), some of them subsequently brushed (D), was measured with the Rhopoint TAMS. The instrument images each field in 3D and delivers areal height values, a perception-linked Quality score and the height maps.
The measurements show:
Please note
| Item | Value |
|---|---|
| Instrument | Rhopoint TAMS |
| Samples | 10 conditions, 2 readings each (20 measurements) |
| Conditions | Dry grinding K36, K180, K240, K320, K400; the grits K240, K320, K400 and K600 additionally brushed after grinding (D); K600 sanded wet |
| Field | 672 x 388 pixels of 0.037 mm = 24.9 x 14.4 mm |
| Instrument values | Sa, Rax and Ray (0.8 mm), Quality and Waviness; heights in µm, lengths in mm |
| Further evaluation | ISO 25178 areal, functional, spatial and lay parameters recomputed from the height maps of every reading |
| Statistics | Mean of the two readings per condition; the scatter of the two readings is used where differences between conditions are small |
Verification of the evaluation. Sa, Rax and Ray recomputed from the height maps with the filter of the TAMS software reproduce the instrument values to within 0.1 % for all 20 readings, and the 1 to 5 mm and 1 to 10 mm bands to within 4 %. This confirms that the instrument's calculation is understood; it does not show that the TAMS amplitudes are accurate. The values describe structures from about 0.8 mm up to the size of the measured area (about 25 x 14 mm); fine roughness below about 0.4 mm does not contribute.
Finer structure, such as the individual scratches of the finer grits, is therefore not described by these values.
| Parameter | What it describes | How to read it |
|---|---|---|
| Sa (µm) | Average height deviation of the filtered surface (structures above about 0.8 mm) from its mean plane; the main height number | Lower = smoother |
| Sq (µm) | Root-mean-square height deviation; like Sa, but weights high peaks and deep valleys more strongly | Lower = smoother; always slightly above Sa |
| Sz (µm) | Height from the highest peak to the deepest valley in the evaluated area | Lower = smoother; single extremes influence it strongly |
| Rax, Ray (µm) | Average height deviation along a line in the horizontal direction (along the scratch lines) and in the vertical direction (across them) | Ray larger than Rax = rougher across the scratches than along them |
| Quality (0 to 100) | TAMS grade of how good the surface looks to an observer | Higher = better |
| Waviness | TAMS value for the longer-wave structure of the surface | Lower = smoother |
| Ssk | Symmetry of the height distribution | 0 = peaks and valleys balanced; positive = peaks dominate; negative = valleys dominate |
| Sku | Peakedness of the height distribution | 3 = random, Gaussian-type surface; above 3 = a few extreme peaks or valleys; below 3 = evenly spread heights |
| Sk, Spk, Svk (µm) | Core height, reduced peak height and reduced valley depth from the material ratio curve (explained below) | Lower = smoother |
| Smr1, Smr2 (%) | Share of the surface where the peaks end (Smr1) and where the valleys begin (Smr2) | Typically about 10 % and 90 %; changes show a change of the curve shape |
| Sal (mm) | Correlation length: the distance over which the surface still resembles itself | Longer = broader, smoother structures |
| Str (0 to 1) | Texture aspect ratio | Near 0 = strongly directional lines; near 1 = the same in all directions |
| Lay angle (degrees) | Direction of the scratch lines against the horizontal axis of the map | 0 = horizontal lines |
| Directional concentration (0 to 1) | How strongly one direction dominates the texture | 1 = a single direction; 0 = no preferred direction |
| Rz along / across lay (µm) | Typical peak-to-valley height of a line profile (mean over 2.5 mm sections), along or across the scratch lines | Lower = smoother |
| Rz ratio | Rz across the lay divided by Rz along the lay | 1 = no difference between the directions; larger = stronger directional character |
| RSm across lay (mm) | Mean spacing of the structure along a line across the scratch lines | Larger = wider structures |
How it is made. All height values of the evaluated area are sorted from the highest to the lowest. The curve plots every height against the share of the surface that lies above it.
The left end of the curve is the highest points of the surface, the right end the deepest valleys, and the middle is the main body of the surface.

What it shows
In this report:
The curves of all conditions (figure in the section on functional parameters) are scaled copies of each other.
Brushing makes the curve flatter without changing its shape: core, peaks and valleys all become smaller.
| Grit | Sa (µm) | Rax (µm) | Ray (µm) | Quality | Waviness |
|---|---|---|---|---|---|
| K36 | 4.76 | 4.55 | 4.74 | 91.7 | 2.49 |
| K180 | 3.88 | 3.56 | 3.85 | 92.7 | 2.18 |
| K240 | 2.90 | 2.56 | 2.88 | 94.7 | 1.58 |
| K320 | 2.43 | 2.28 | 2.39 | 95.4 | 1.38 |
| K400 | 2.12 | 2.03 | 2.09 | 95.8 | 1.25 |
| K600 sanded wet | 0.79 | 0.72 | 0.67 | 98.8 | 0.37 |
| Grit | Sa (µm) | Rax (µm) | Ray (µm) | Quality | Waviness |
|---|---|---|---|---|---|
| K240 D | 1.31 | 1.14 | 1.28 | 97.6 | 0.71 |
| K320 D | 0.83 | 0.69 | 0.76 | 98.5 | 0.44 |
| K400 D | 0.75 | 0.65 | 0.69 | 98.7 | 0.39 |
| K600 D | 0.54 | 0.51 | 0.42 | 99.1 | 0.28 |
| Grit | Sa ground to D (µm) | Sa change | Quality ground to D | Waviness change |
|---|---|---|---|---|
| K240 | 2.90 to 1.31 | -54.6 % | 94.7 to 97.6 | -54.8 % |
| K320 | 2.43 to 0.83 | -65.9 % | 95.4 to 98.5 | -68.2 % |
| K400 | 2.12 to 0.75 | -64.6 % | 95.8 to 98.7 | -69.1 % |
K600 D against K600 sanded wet (a different process):
Sa 0.54 µm against 0.79 µm, 30.8 % lower.


The parameters below are computed from the instrument's height maps for every reading; the tables show the mean of the two readings. The Sa values equal the instrument values above.
Method
| Condition | Sa (µm) | Sq (µm) | Ssk | Sku | Sz (µm) |
|---|---|---|---|---|---|
| K36 | 4.76 | 6.08 | 0.13 | 3.34 | 42.9 |
| K180 | 3.88 | 4.95 | -0.17 | 3.55 | 39.1 |
| K240 | 2.89 | 3.63 | 0.03 | 3.06 | 26.7 |
| K240 D | 1.31 | 1.65 | 0.02 | 3.06 | 11.5 |
| K320 | 2.42 | 3.08 | 0.11 | 3.37 | 23.5 |
| K320 D | 0.83 | 1.05 | 0.17 | 3.12 | 7.4 |
| K400 | 2.12 | 2.70 | -0.01 | 3.40 | 21.1 |
| K400 D | 0.75 | 0.96 | 0.29 | 3.32 | 6.7 |
| K600 sanded wet | 0.79 | 0.99 | 0.34 | 3.15 | 6.8 |
| K600 D | 0.54 | 0.68 | 0.24 | 3.02 | 4.5 |
Sku stays between 3.0 and 3.6 for every condition, the value of a random, Gaussian-type surface: no isolated deep scratches stand out. Ssk is close to zero on the ground samples (-0.17 to 0.13) and positive on the brushed and wet-sanded samples from K320 D on (0.17 to 0.34); with two readings per condition this is an indication only.
| Condition | Sk (µm) | Spk (µm) | Svk (µm) | Smr1 % | Smr2 % | Spk/Sk | Svk/Sk |
|---|---|---|---|---|---|---|---|
| K36 | 14.64 | 6.86 | 6.08 | 11.4 | 89.4 | 0.47 | 0.42 |
| K180 | 12.33 | 4.60 | 6.14 | 10.0 | 90.2 | 0.37 | 0.50 |
| K240 | 9.46 | 3.66 | 3.46 | 9.3 | 90.3 | 0.39 | 0.37 |
| K240 D | 4.31 | 1.72 | 1.64 | 8.9 | 90.2 | 0.40 | 0.38 |
| K320 | 7.76 | 3.48 | 3.08 | 10.3 | 90.5 | 0.45 | 0.40 |
| K320 D | 2.62 | 1.22 | 0.96 | 11.3 | 90.5 | 0.46 | 0.37 |
| K400 | 6.76 | 2.82 | 2.94 | 10.6 | 90.6 | 0.42 | 0.43 |
| K400 D | 2.31 | 1.17 | 0.86 | 12.6 | 90.5 | 0.50 | 0.37 |
| K600 sanded wet | 2.51 | 1.17 | 0.78 | 11.7 | 91.9 | 0.47 | 0.31 |
| K600 D | 1.79 | 0.74 | 0.52 | 10.5 | 91.7 | 0.42 | 0.29 |
| Grit | Sk ground to D (µm) | Spk ground to D (µm) | Svk ground to D (µm) |
|---|---|---|---|
| K240 | 9.46 to 4.31 (-54 %) | 3.66 to 1.72 (-53 %) | 3.46 to 1.64 (-53 %) |
| K320 | 7.76 to 2.62 (-66 %) | 3.48 to 1.22 (-65 %) | 3.08 to 0.96 (-69 %) |
| K400 | 6.76 to 2.31 (-66 %) | 2.82 to 1.17 (-59 %) | 2.94 to 0.86 (-71 %) |

Brushing lowers Sk, Spk and Svk by about the same fraction (53 to 71 %). Spk/Sk (0.37 to 0.50), Smr1 and Smr2 do not move systematically, and the curves in the figure are scaled copies of each other. For structures above about 0.8 mm, brushing therefore reduces the amplitude of the whole texture; it does not truncate the peaks to form a load-bearing plateau. Whether it does so on finer scales cannot be seen in these values.
| Condition | Lay angle (deg) | Directional concentration | Str | Sal (mm) | Rz along lay (µm) | Rz across lay (µm) | Rz ratio | RSm across lay (mm) |
|---|---|---|---|---|---|---|---|---|
| K36 | 1.2 | 0.80 | 0.19 | 0.69 | 6.9 | 16.8 | 2.4 | 3.0 |
| K180 | -2.6 | 0.74 | 0.27 | 0.68 | 6.6 | 13.7 | 2.1 | 2.7 |
| K240 | 3.3 | 0.73 | 0.22 | 0.68 | 5.0 | 9.8 | 2.0 | 2.9 |
| K240 D | -0.9 | 0.78 | 0.18 | 0.68 | 2.2 | 4.4 | 2.0 | 2.7 |
| K320 | -1.5 | 0.64 | 0.37 | 0.74 | 4.5 | 8.1 | 1.8 | 3.0 |
| K320 D | -2.4 | 0.56 | 0.29 | 0.95 | 1.5 | 2.5 | 1.6 | 2.9 |
| K400 | 0.6 | 0.73 | 0.29 | 0.66 | 4.1 | 7.5 | 1.8 | 2.6 |
| K400 D | -1.8 | 0.58 | 0.35 | 1.01 | 1.4 | 2.4 | 1.7 | 3.1 |
| K600 sanded wet | 7.0 | 0.49 | 0.58 | 1.05 | 1.6 | 2.2 | 1.4 | 3.0 |
| K600 D | -7.2 | 0.34 | 0.22 | 1.22 | 1.1 | 1.4 | 1.3 | 2.7 |
1. The grit ladder is resolved. Sa and Waviness fall and Quality rises with every finer dry grit. The mean Sa steps are 0.88 µm (K36 to K180), 0.98 µm (K180 to K240), 0.47 µm (K240 to K320) and 0.31 µm (K320 to K400), and the two readings of neighbouring grits never overlap. With two readings per grit this is an indication, not a statistical proof.
2. Two process regimes. K36 to K400 lowers Sa by 55.5 %. K400 to K600 sanded wet lowers it by a further 62.9 %. The wet-sanded K600 sample belongs to a different process, not to the dry ladder.
3. Brushing is worth about two grit steps. It lowers Sa and Waviness and lifts Quality above 97.5 at every grit. The material ratio parameters show that it scales down peaks and valleys alike.
4. The starting grit is erased from K320 on. After brushing, the Sa differences between K240 D, K320 D, K400 D and K600 D are 0.49 µm (K240 D to K320 D), 0.07 µm (K320 D to K400 D) and 0.21 µm (K400 D to K600 D), calculated from the unrounded values. Only the K240 to K320 step and the K400 to K600 step are clearly resolved.
5. The lay and its loss are measurable. The scratch direction is visible in the maps and quantified by the directional concentration and the Rz ratio. The ratio of RSm across and along the lay, which Str is meant to describe, tends to rise from 0.37 (K36) to 0.42 to 0.51 for the brushed and wet-sanded samples, in line with the other anisotropy measures.
Published work on ground and brushed steel mostly relies on stylus Ra values and on tables relating grit to Ra. We found no areal (ISO 25178) data for brushed stainless steel by grit, so a direct comparison with published values is not possible. There are three points of contact:
Sources:
[1] Bulaha et al., study of flat-ground surfaces, 2015: https://www.iitf.lbtu.lv/conference/proceedings2015/Papers/131_Bulaha.pdf.
[2] Bulaha et al., Research of Surface Roughness Anisotropy, 2017: https://ortus.rtu.lv/science/en/publications/25401.
Well suited to process control of matt and satin steel finishes. For acceptance of a finished brushed surface, confirm the Quality scale on your own samples.
What supports this
What to keep in mind
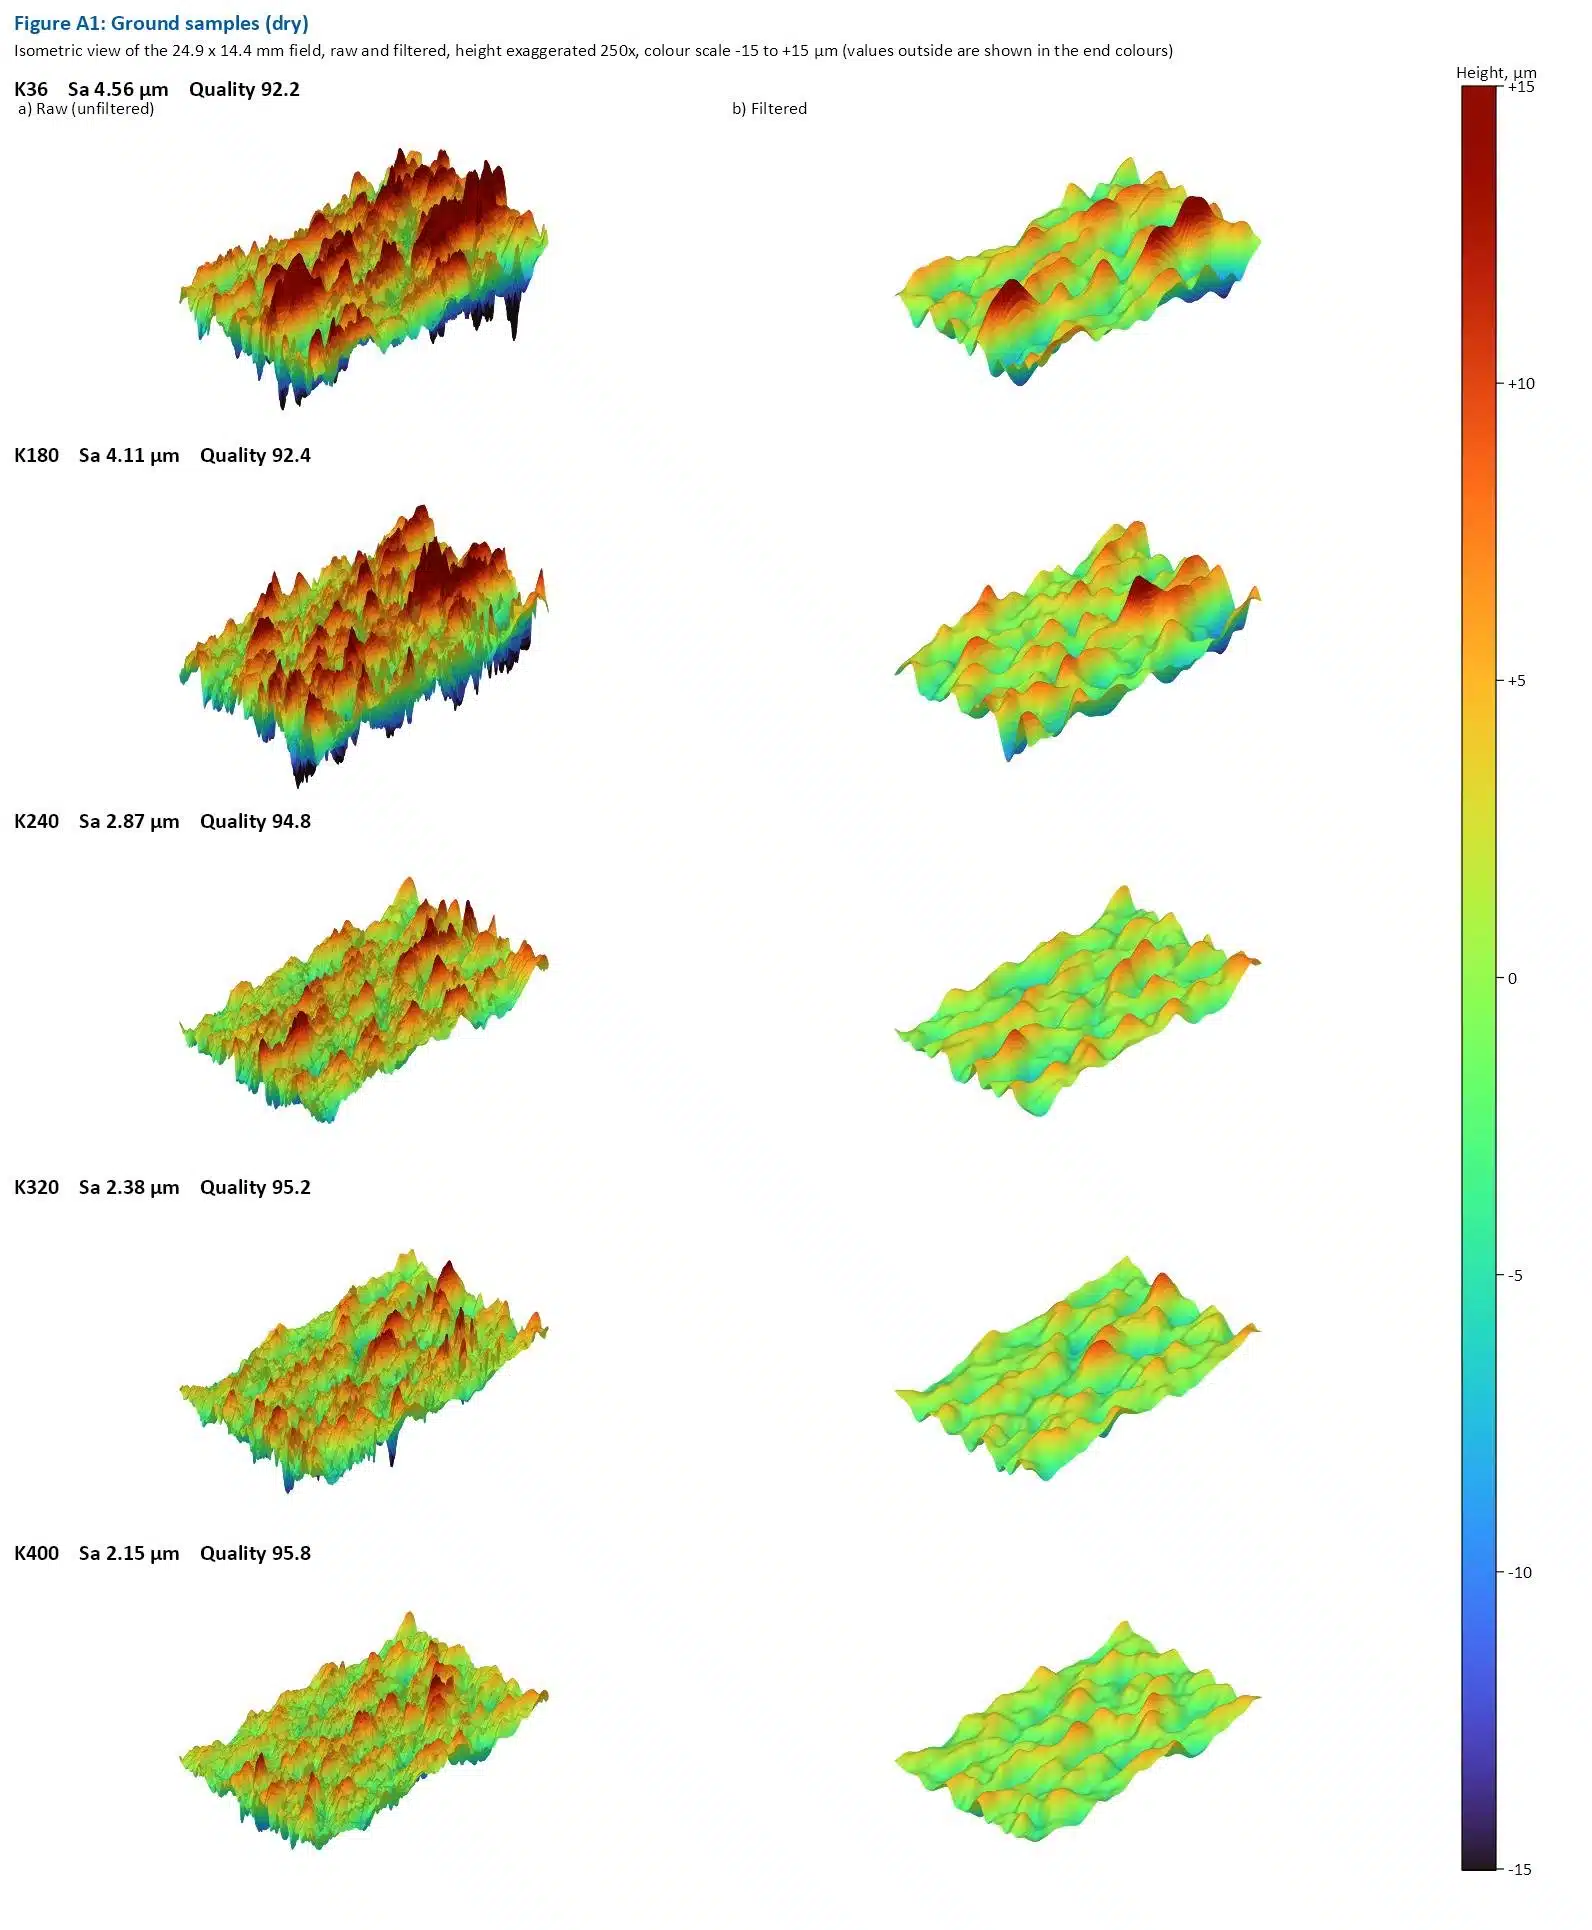
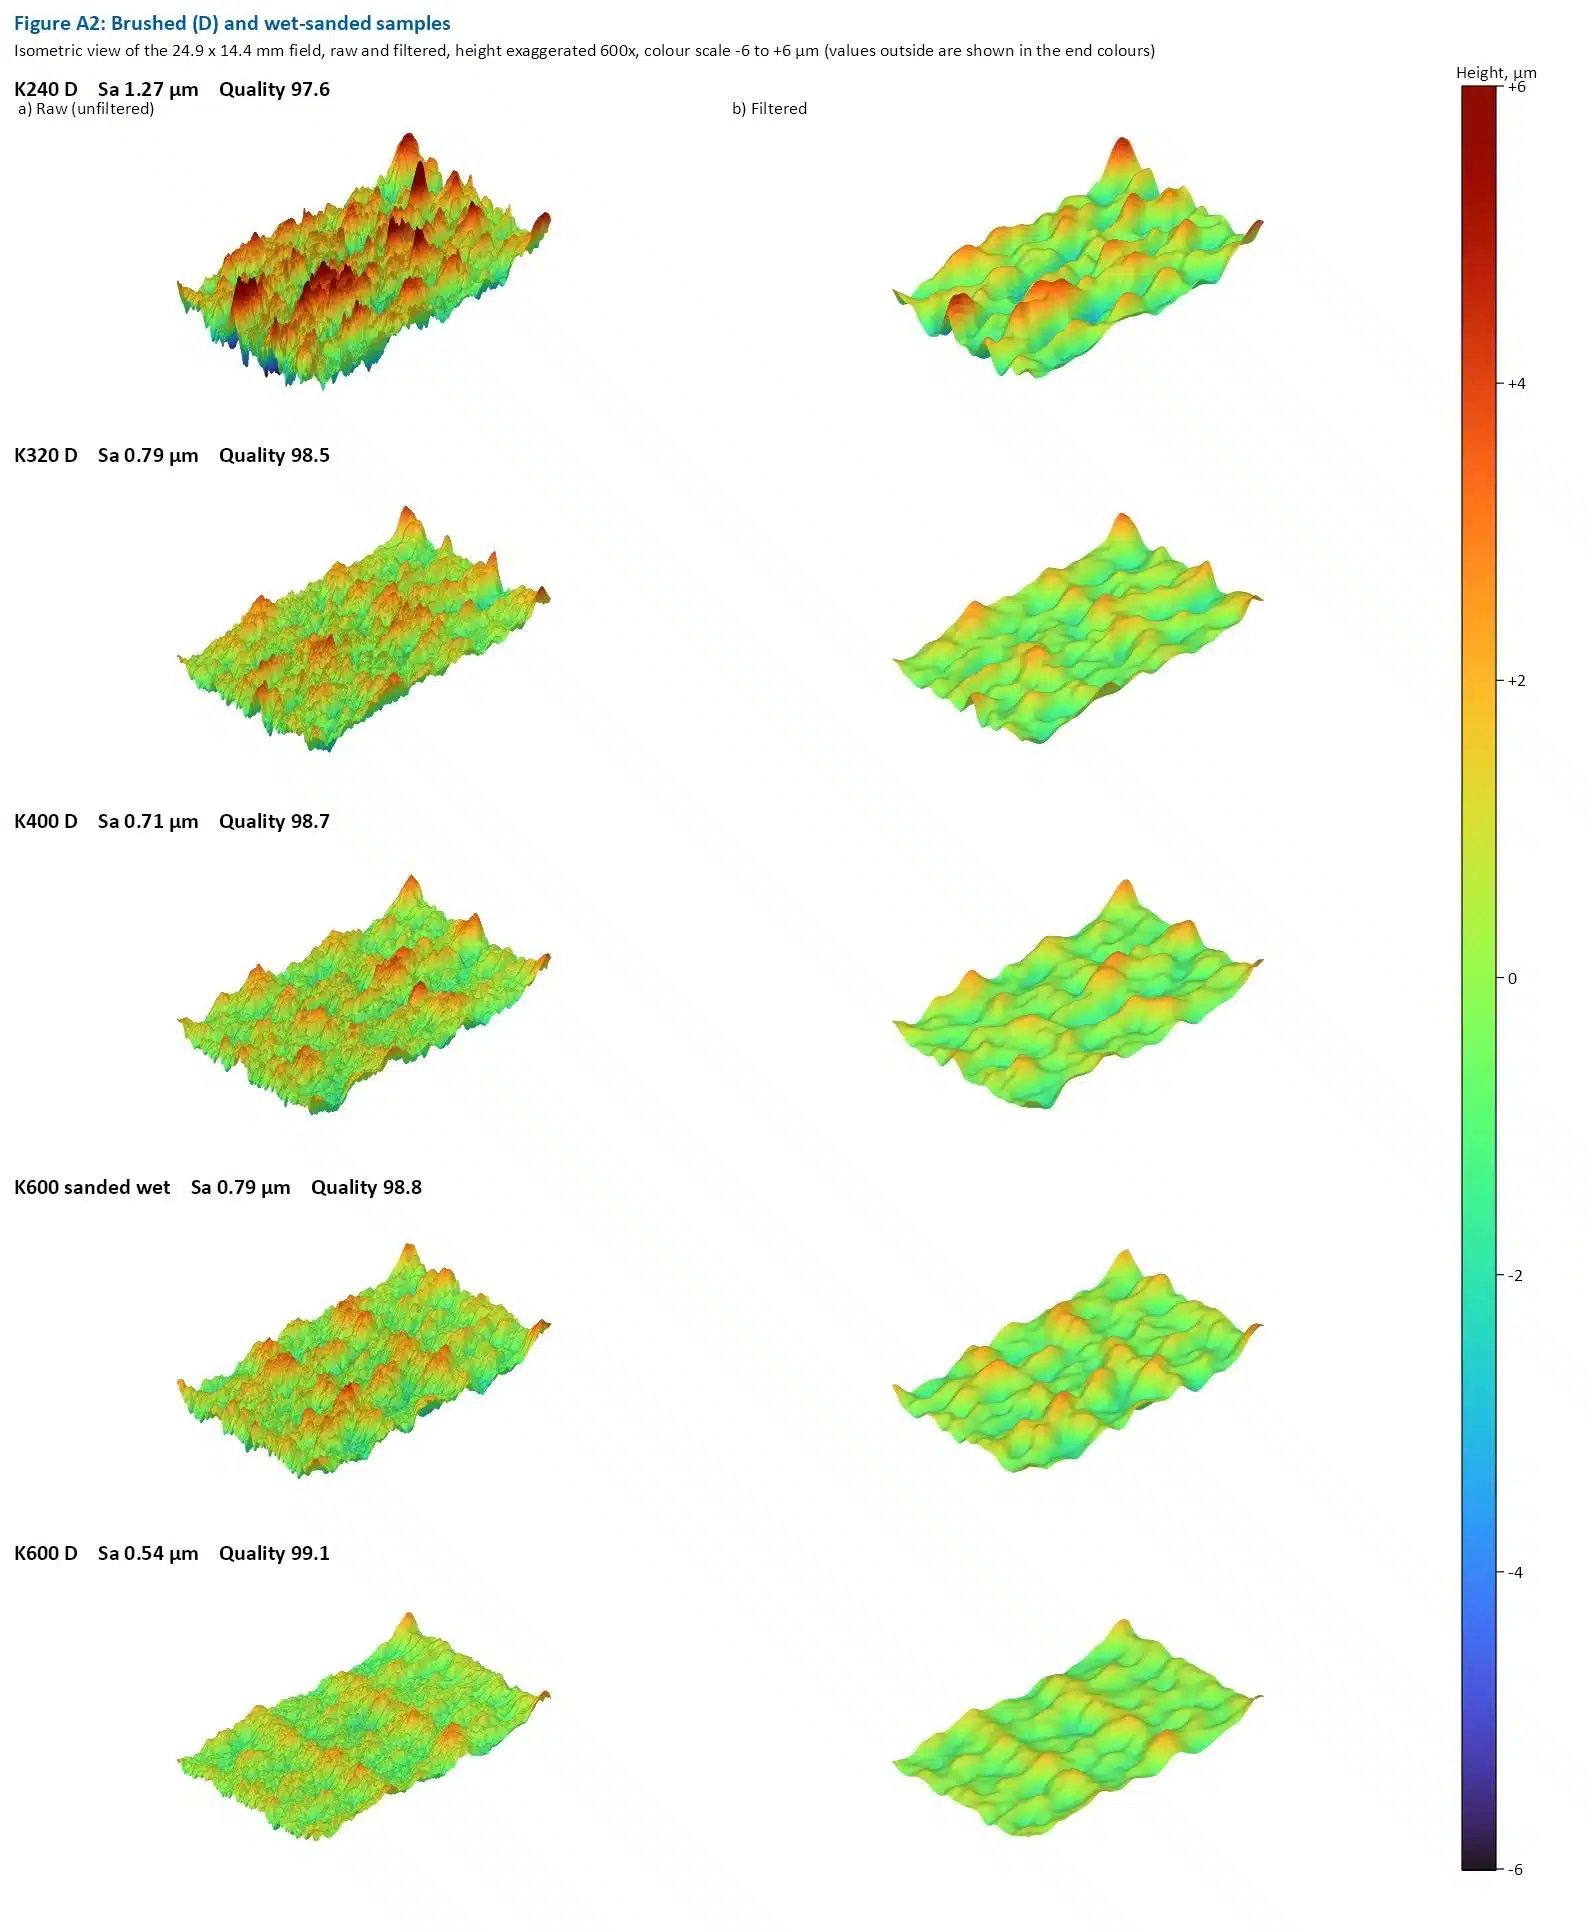
This annex shows the measured height maps of all ten conditions as isometric 3D views. It illustrates what the parameters in this report describe: the height, direction and size of the structures on the surface.
How to read the figures
The results refer to the sample set measured and are not specification values.
Contact:
Europe: info@rhopointinstruments.de
North, South and Central America: sales@rhopointamericas.com
Global and UK: sales@rhopointinstruments.com
Online presentation of your chosen instrument with your samples measured LIVE on Zoom, Microsoft Teams or Skype. Includes a consultation with an application specialist.