
이 페이지는 아직 한국어로 번역되지 않아 영어로 표시됩니다.
Data Table
Data table overview The data table in Appearance Elements (AE) is the central place where all measurements from connected instruments are listed, organised and edited. Each row represents a single measurement, while columns show key information such as batch name, instrument, module, time stamp and all selected parameters for that result (for example gloss, haze, waviness, roughness or scratch metrics).
Click the magnifier icon for any row in the data table to open that measurement and view all associated content, including images, topographical maps, profiles and graphs.
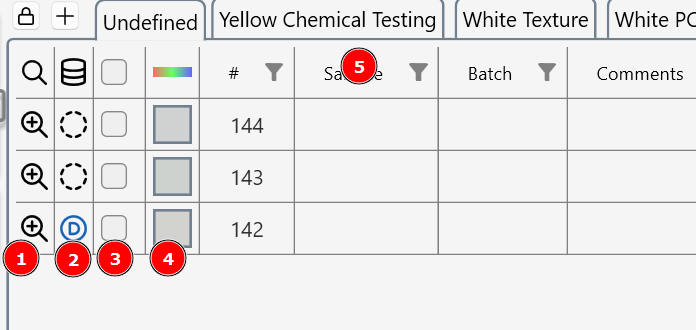
- Use the magnifier lens to see measurement images, graphs and topographical maps.
- Click the database column to add a measurement to the database.
- Select a measurement row(s) for **copy and paste**, add to the database, or **deletion**.
- A colour patch represents the measured RGB colour of the surface.
- Right click on column heading to access filter and sort tools.